How to view resource usage information in Plesk
This article describes how to view resource usage information in Plesk.
Table of Contents
Viewing resource usage
To view resource usage information in Plesk, follow these steps:
- Log in to Plesk.If you do not know how to log in to your Plesk account, please see this article.
- In the right sidebar of the Plesk home screen, click Resource Usage:
After a few moments, the resource usage dashboard appears. Depending on your account's resource usage, you may see:
- Your site had no issues in the past 24 hours: If you receive this message, your account did not trigger any limits within the past 24 hours.
- Your site has been limited within the past 24 hours: If you receive this message, your account triggered at least one resource limit within the past 24 hours. Plesk displays additional information about which resource (or resources) triggered the limit.
- Your site might hit resource limits soon: This message is a warning that your account may trigger resource limiting in the near future. Plesk displays additional information about which resource is at risk of triggering a limit.
To view detailed resource usage information for your account, click the button or click the Current Usage tab:

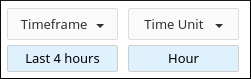
Plesk displays usage graphs and a usage table for the current day. To change the time interval displayed, in the Timeframe list box, select the range of time to be displayed. In the Time Unit list box, select the interval between the data points to display:
To view a resource usage snapshot, click the Snapshot tab:

Depending on your account's resource usage, cPanel may display a list of processes and a list of HTTP queries:
- Use the arrow buttons to view snapshots in sequence.
- Use the calendar list box to select a specific date to view.
- Use the Choose Snapshot list box to select a specific snapshot to view.
Article Details
- Control Panel: Plesk
- Level: Beginner
Did you find this article helpful? Then you'll love our support. Experience the A2 Hosting difference today and get a pre-secured, pre-optimized website. Check out our web hosting plans today.